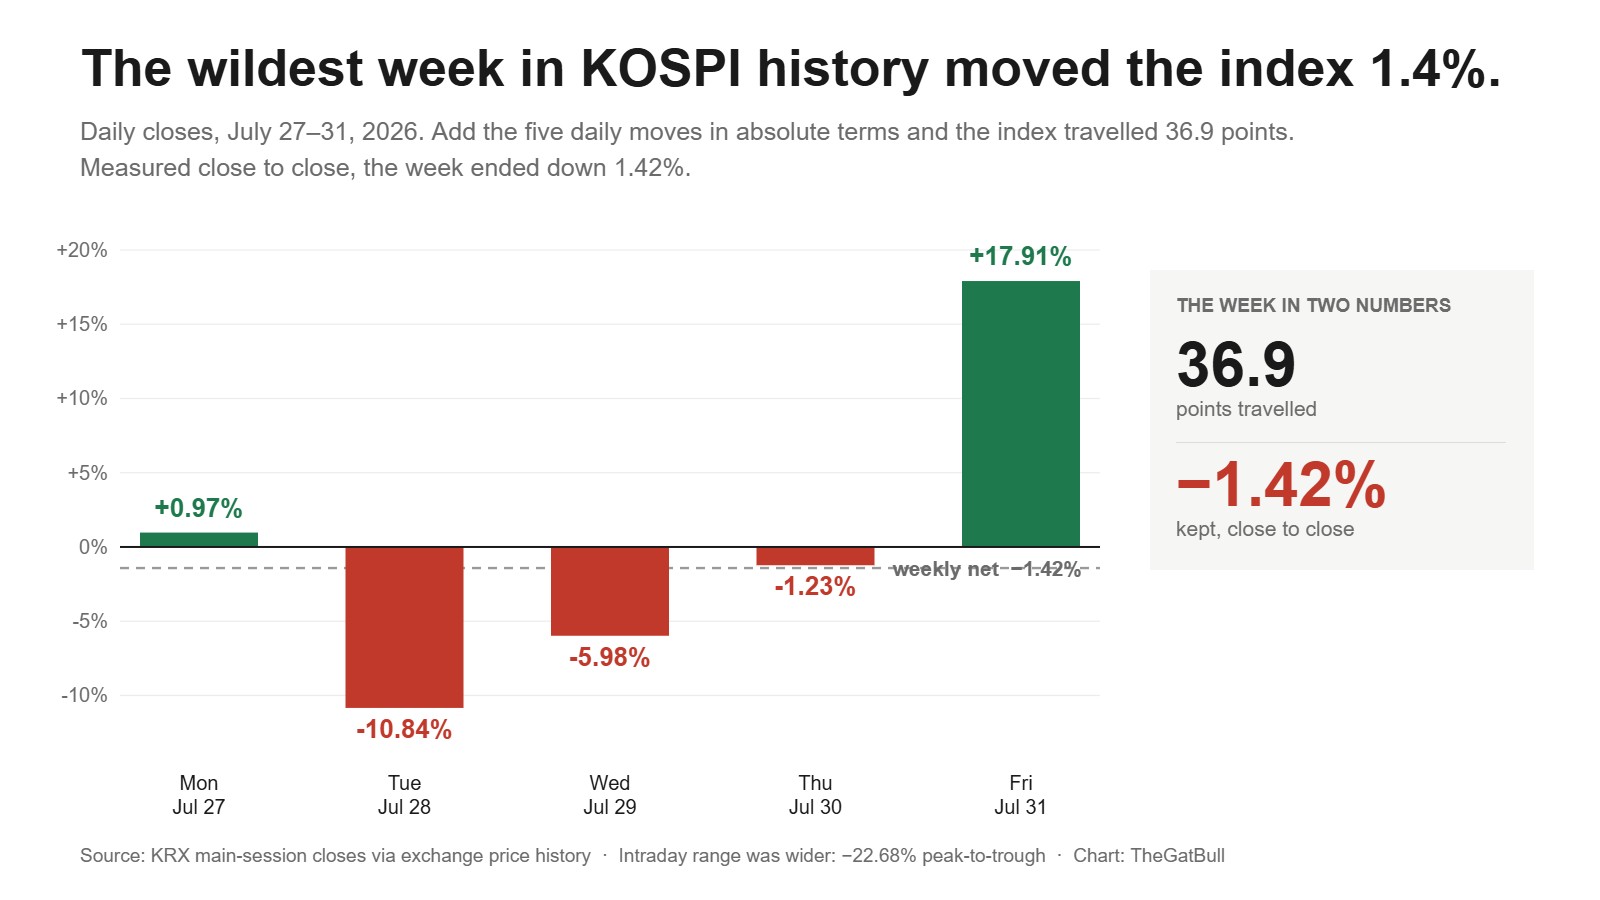
In the last week of July 2026 — Monday the 27th through Friday the 31st — the KOSPI recorded a −10.84% session and a +17.91% session, the largest one-day gain in its history, inside the same five trading days. Add the five daily moves in absolute terms and the index travelled 36.9 percentage points.
The week’s net change was −1.42% (6,690.62 → 6,595.45, KRX main-session closes).
And the month those five sessions closed out fell 22.19%. Headlines called it the worst month in KOSPI history. Measured month-end close to month-end close, it ranks third.
▶ What this means for global investors
① Range and return are different quantities. A week can be the most violent on record and still finish flat. Which one you experienced depended on your leverage and your holding period, not on the market.
② “Worst ever” is a measurement choice. On month-end closes, July 2026 sits behind October 1997 and October 2008. Most coverage never said which window it was measuring.
(Index and share prices are KRX main-session closes; intraday figures are labelled. FX basis: USD/KRW 1,424.0, Seoul close 3:30 p.m., July 31, 2026. This article is one person’s view, not advice.)
The week: five sessions, both directions
| Date (KST) | KOSPI close | Daily | What happened |
|---|---|---|---|
| Mon Jul 27 | 6,755.75 | +0.97% | An attempted bounce |
| Tue Jul 28 | 6,023.66 | −10.84% | Circuit breaker |
| Wed Jul 29 | 5,663.24 | −5.98% | First back-to-back circuit breakers on record · intraday low 5,262.77 |
| Thu Jul 30 | 5,593.56 | −1.23% | The week’s closing low |
| Fri Jul 31 | 6,595.45 | +17.91% | Largest one-day gain on record |
| Week | 6,690.62 → 6,595.45 | −1.42% | 36.9 points travelled; this much kept |
The intraday range belongs in its own line. From Monday’s intraday high of 6,806.27 to Wednesday’s intraday low of 5,262.77 is −22.68% (intraday). On closing prices the week was nearly flat. On intraday prices it contained an entire bear market.
Three notes.
1. Friday saved the week. Strip out July 31 (+17.91%) and the week finishes around −16.4%. On that single session foreign investors net bought ₩7.2196tn (about $5.07bn, KRX main session) while retail investors net sold ₩8.2543tn. That the donghak gaemi — Korea’s retail army, named after an 1894 peasant uprising — sold in record size on the market’s best day is taken apart here.
2. The single names travelled further than the index and came back. Samsung Electronics (KRX: 005930) finished the week +5.21% at ₩262,500 (about $184). SK Hynix (KRX: 000660) finished −2.33% at ₩1,718,000 (about $1,207) — Friday’s limit-up close of +29.95% was not enough to recover its week.
3. The currency settled its direction in the same week. USD/KRW went from 1,462.5 on July 28 to 1,424.0 on July 31 at the Seoul 3:30 p.m. close — a fourth consecutive session of won strength. What the authorities actually said that week, and what was only reported, is set out here.
The month: worst ever? The closing bell disagrees
July’s monthly change was 8,476.48 (June 30 close) → 6,595.45 (July 31 close) = −22.19%. Put that against the deepest monthly declines on the same basis — month-end close to month-end close, from exchange price history covering January 1997 onward:
| Rank | Month | Monthly decline | What was happening |
|---|---|---|---|
| 1 | October 1997 | −27.25% | The Asian financial crisis — the month Korea went to the IMF |
| 2 | October 2008 | −23.13% | Just after Lehman — the month American readers remember directly |
| 3 | July 2026 | −22.19% | AI memory competition shock plus a leverage unwind |
One caveat on the ranking itself: the price history used here begins in January 1997. Months before that are outside the dataset, so “third” means third across those 355 months, not across the index’s entire life since 1980.
The gap between the headlines and this table is the measurement window. Published figures ranged from −22% to −34% — some measured from the intramonth high, some to the intraday low. Standardised to month-open to month-close, July 2026 is third.
There is also a difference in kind. 1997 and 2008 were currency and credit crises. July 2026 was a position unwind — which is roughly what the Bank of Korea governor meant on July 16 when he said equities do not have many channels through which they connect to systemic risk. Not a perfect parallel.
🎩 Under the Gat — Range makes headlines; returns are calculated on closes. When you hear “worst ever,” ask the worst of what? Intraday or close, from the high or from the first of the month. That single question is the cheapest risk management available in this market.
For US accounts: EWY ran a different calendar
The US-listed EWY (iShares MSCI South Korea ETF) belongs in its own table, on US trading days — because the one-day offset from Seoul was the structural story of this week.
| US session | EWY close | Change |
|---|---|---|
| Mon Jul 27 | $161.20 | −1.08% |
| Tue Jul 28 | $151.45 | −6.05% |
| Wed Jul 29 | $144.21 | −4.78% |
| Thu Jul 30 | $161.21 | +11.79% |
| Fri Jul 31 | $157.10 | −2.55% |
| Week | −3.60% | July: −22.19% |
Seoul’s +17.91% Friday was Thursday night in New York. EWY priced that rebound during the US Thursday session (+11.79%) — which follows, since the US earnings that triggered it landed in US hours. By the US Friday, after Seoul had actually printed its record, EWY cooled to −2.55%.
That EWY’s July (−22.19%) landed on the same number as the KOSPI’s July (−22.19%) is closer to coincidence than to design — currency and timing effects happened to offset. Why EWY is effectively a bet on two stocks is broken down here.
The previous week’s scoreboard, for the series, is here.

The summary
The most violent week in this index’s history moved it 1.42%. July was the third-deepest month on the closing bell, not the first — “worst ever” was a sentence the measurement window produced. Range and return are different quantities.
There are accounts that remember this week as −1.4% and accounts that remember it as −22.7%. The difference was not the market. It was leverage and the clock.
This article is a personal view provided for informational purposes and is not investment advice or a solicitation to trade. Index and share prices are KRX main-session closes for the dates stated; intraday figures are labelled as such. EWY figures are US-listed closes on US trading days. Investor flow figures are KRX main-session values. FX basis: USD/KRW 1,424.0, Seoul close 3:30 p.m., July 31, 2026. Monthly rankings are drawn from exchange price history beginning January 1997. Mr. Gat holds no position in the individual stocks mentioned.
FAQ
What happened to the Korean stock market in July 2026?
The KOSPI fell 22.19% over the month on KRX closing prices, and inside the same month recorded its largest one-day gain on record (+17.91% on July 31). The decline was triggered by Chinese memory competition and a leverage unwind; the reversal followed US big-tech earnings and record foreign buying (₩7.22tn on July 31, KRX main session).
Was July really the worst month in KOSPI history?
It depends on the window. On month-end closing prices it ranks third, behind October 1997 (−27.25%) and October 2008 (−23.13%), across price history from January 1997. Measured from the intramonth high or to the intraday low the figure is larger — the index closed July still 27.64% below its June 22 record close of 9,114.55. Most coverage did not state which window it used.
How much did the KOSPI move during the week of July 27–31?
The five daily moves summed in absolute terms to 36.9 percentage points, but the week’s net change was −1.42% (6,690.62 → 6,595.45). The intraday range was wider: −22.68% from Monday’s high to Wednesday’s low.
Were circuit breakers unusually frequent?
July 28–29 brought the first back-to-back circuit breakers in the market’s history, and the July 31 rebound triggered buy-side sidecars on both the KOSPI and the KOSDAQ. Korean media put the year’s sidecar count at 37, more than in all of 2008 — a figure attributed to media reporting and not yet checked against exchange records here.
How did Samsung Electronics and SK Hynix finish the week?
Samsung closed the week +5.21% at ₩262,500; SK Hynix closed −2.33% at ₩1,718,000 despite a limit-up (+29.95%) session on July 31.
Did EWY move with the KOSPI?
Not on the same days. Seoul’s record Friday was Thursday night in New York, and EWY priced the rebound in the US Thursday session (+11.79%), then fell 2.55% on the US Friday. EWY finished the week −3.60% and the month −22.19%.
Should I buy Korean stocks now?
This site does not answer that — a view, not advice. What this scoreboard does say: some accounts remember this week as −1.4% and others as −22.7%, and the difference was leverage and holding period, not the market.